IntelliTrace Tips and Tricks: IntelliTrace Everywhere

Series Links:
- Part 1: The Basics (this post) – also guest posted on MSDevDiv SA Blog
- Part 2: IntelliTrace Everywhere – also guest posted on MSDevDiv SA Blog
- Part 3: Enable Custom IntelliTrace Events with a Right-Click
In my previous post I showed you how to enable IntelliTrace for debugging – F5 IntelliTrace. That’s all well and good, but what about getting IntelliTrace logs from your test environments? Or from production?
Here’s where you can use IntelliTrace:
- .NET 2.0 and above managed code (note: the collector requires .NET 3.5, so you’ll need that on the target server even if you app is in .NET 2.0)
- Enable the IntelliTrace diagnostic adapter in Test Manager to collect logs during test runs
- IIS: Use PowerShell to attach to an application pool and collect logs
- Desktop Apps: Use IntelliTraceSC.exe to launch an app and collect logs
- Windows Services: This one is tough, but possible. Involves some registry tweaking. Read more here.
Here’s where you can’t collect IntelliTrace:
- Silverlight applications
- Windows Phone applications
- .NET 1 applications
- Native code applications
The IntelliTrace Standalone Collector
You can get this from the Visual Studio installation folder, or you can download it here. I recommend downloading it, since this will be the latest and greatest collector available. The page has a link to instructions about how to extract the cab file. Once you’ve expanded the cab, you’ll have the PowerShell module as well as the IntelliTraceSC.exe for collecting application data.
Symbols
Before we look at how to collect logs, let’s talk about symbols. In order to open up code from the iTrace logs, you’re going to need to supply symbols. Ever seen a pdb file when you compile your apps? The pdbs map source code to compiled code. But of course no self-respecting developer ever deploys pdbs, right? So if you’re not deploying your pdbs (and you shouldn’t be) then where do you put them? You get the build to publish them to a shared folder, or Symbol Server. (If you don’t use Team Build, you can simply keep your pdbs somewhere – when you open an iTrace file, you can provide the location of your pdbs).
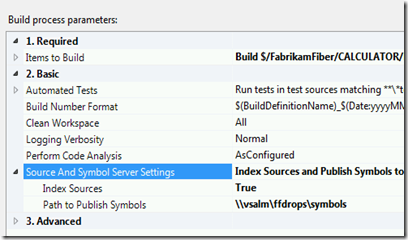
Here’s an image showing where in the DefaultTemplate you can set the symbols location:
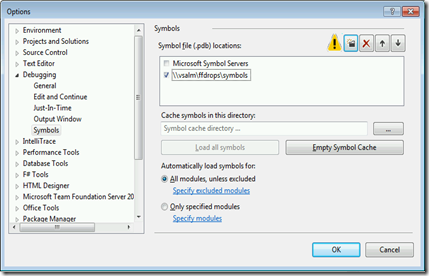
One more thing – you’ll need to set this location in the Debugging options of VS in order for it to look there for the symbols. In VS, go to the Tools->Options dialog. Then expand the Debugging->Symbols section. There are some buttons in the top right of the dialog – click the “New Location” icon (between the yellow warning icon and the ‘x’ button) and type in the same directory that you used in the Build Process settings (above).
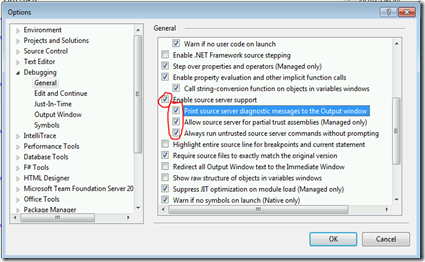
You’ll also need to open the “General” tab under Debugging and set the following checkboxes:
Now you’re ready to open the logs – let’s see how you can collect them.
Collect IntelliTrace from Web Applications
If you’re developing and deploying web applications, you get a lot of love from IntelliTrace. Here are the steps you’ll need to follow to start logging:
- Download the IntelliTrace collector and expand it.
- Find the name (and identity) of the application pool that your web app is running under.
- Create a log folder. Make sure the app pool identity has write access to this folder.
- Open a PowerShell prompt. Go to the IntelliTrace folder. Run “Import-Module Microsoft.VisualStudio.IntellITrace.PowerShell.dll”
- To list the commands, type “Get-Command *IntelliTrace*”. This will list the 5 IntelliTrace cmdlets.
- To start logging, type Start-IntelliTraceCollection –ApplicationPool AppPoolName –CollectionPlan plan.xml –OutputPath logPath
where
- AppPoolName is the name of the app pool your application is running under
- plan.xml is the collection plan (more on this in the next paragraph)
- logPath is the path you want the log files dropped into
The plan.xml is the settings file for what IntelliTrace events you want to collect (and if you’re running in Events Only or Events and Call Information mode). You’ll see 2 xml files in the IntelliTrace folder that ship with IntelliTrace – the lightweight collection_plan.ASP.NET.default.xml and the diagnostic collection_plan.ASP.NET.trace.xml. I recommend starting with the default plan (Events Only) and if you get stuck then dial it up to the trace plan (Events and Call Information). In the next post, I’ll show you how to customize the collection to get fine-grained control over the events.
Be aware that when you run Start-IntelliTraceCollection, IntelliTrace will attach itself to the app pool, but part of that will require a recycle.
Don’t leave this on too long – especially if you’re using the trace plan. One the collector is running, you can use the following commands when you want to grab the log and open it:
- Stop-IntelliTraceCollection – which stops the collector entirely
- Checkpoint-IntelliTraceCollection – which unlocks the log file and starts logging to a new log file
Use checkpoint when you want to open the log and leave the collector running (when the collector is running the file is locked by the collection process, so you won’t be able to open it).
Collect IntelliTrace from Desktop Applications
Collecting IntelliTrace from Desktop apps gets some love – not as much as the IIS scenario. Instead of launching your application directly, go to the IntelliTrace collector folder and run the following command: IntelliTraceSC.exe help launch
to see the help on how to launch. Here’s the basic launch command: IntelliTraceSC.exe launch /cp:plan.xml /f:pathToLogFile application
where
- plan.xml is the collection plan – use the same ones as the web collection command – don’t worry that it’s called ASP.NET – it’ll work for most default scenarios
- pathToLogFile is the full path and filename of the log file
- application is the path to the application you want to collect the log from
As soon as you exit your application, the logging completes and you’ll have your log file.
Happy logging!


