Enable Custom IntelliTrace Web Events with a Right-Click

Series Links:
- Part 1: The Basics (this post) – also guest posted on MSDevDiv SA Blog
- Part 2: IntelliTrace Everywhere – also guest posted on MSDevDiv SA Blog
- Part 3: Enable Custom IntelliTrace Events with a Right-Click
Note: This is an unsupported feature! Use at your own risk – though to be honest I can’t see what the risk really is. Just know that this is not supported by Microsoft.
Preamble (TL;DR – skip to next section for the Good Stuff)
I’m going to be presenting 3 deep dives at TechEd Africa next week:
- Version Control (including Git)
- Agile Planning Tools and Customizations
- IntelliTrace
While I was preparing for my IntelliTrace session, I was watching Larry Guger (IntelliTrace PM) do a presentation when IntelliTrace-in-Production had just launched. Right at the end of his talk, he did something which boggled my mind – he right-clicked a method and right there in the context menu was “Insert IntelliTrace Event”. He did this for a couple of methods, and then exported these events to a folder. When he ran the IntelliTrace collector for IIS using PowerShell, the custom events were present in the log file.
This was amazing because I know how tedious it is to create custom IntelliTrace events. I quickly fired up my VS just to see if I could do it – and couldn’t find the menu option.
I then mailed Larry and after a short email conversation and some scratching around the IntelliTrace dll’s with Reflector, I was able to figure out that if you add a registry entry, you “unlock” this feature.
This is a “partially complete” feature in VS – here is the big limitation:
This only works with IntelliTrace collection for IIS applications via PowerShell.
The Good Stuff
So I’ll cut to the chase: here’s the registry key: Windows Registry Editor Version 5.00 [HKEY_CURRENT_USER\Software\Microsoft\VisualStudio\11.0_Config\TraceDebugger]
"IntelliTraceEventsEnabled"=dword:00000001
Just copy and paste this into a file (intelli.reg or something) and double-click it. Restart VS.
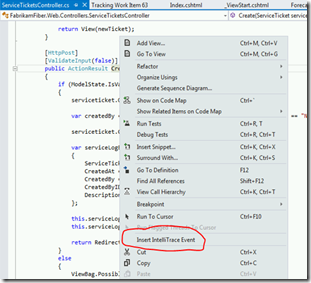
Now open up a Web Application, find a method, right click, select “Insert IntelliTrace Event”. Repeat for a couple of other methods. You’ll see a glyph in the gutter indicating that you have an event for that method.
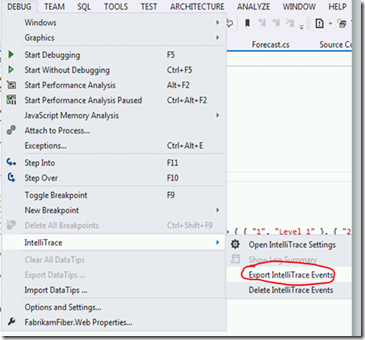
Now go to Debug->IntelliTrace->Export IntelliTrace Events. Save this file to a folder somewhere.
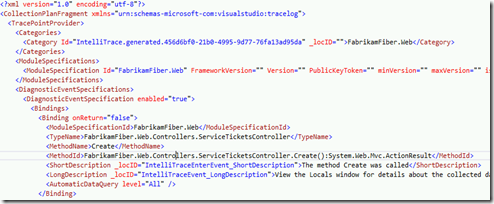
You’ll see that the file has an .iFragment extension – this is an IntelliTrace config fragment. If you open up the file, you’ll see it has created Category, Module and Diagnostic sections – these are the same sections you’d have to manually create if you wanted some custom IntelliTrace events.
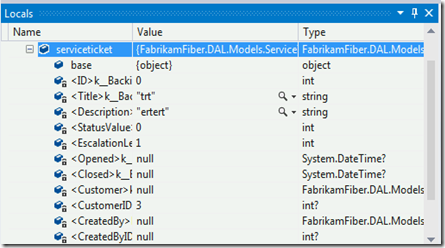
Aside: You can see the “AutomaticDataQuery” element in the tag. This allows you to see the in/out arguments of the method in the locals window when you debug the log file later… No messing around with argument positions and stuff…
Using iFragments
Now that you have a custom iFragment, you need to go to the server that you want to collect IntelliTrace events from. Go to the folder where you extracted the collector and open (or create) a folder called CustomEvents. This is where you drop your iFragments.
Now fire up your collector (using the default collection plan). Collect a log. Open it in VS. Start debugging.
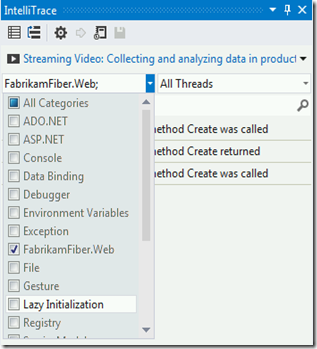
The first thing to note is that you have a custom category in the categories list of the IntelliTrace events window:
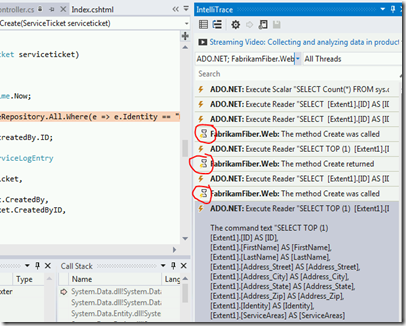
Secondly, you’ll see the events by the same glyph that you saw when you added the events in VS:
Happy logging!
