Azure DevOps Build and Test Reports using OData and REST in PowerBI

- TL;DR
- Exploring Metadata
- Connecting with PowerBI
- Performance – Be Mindful
- Limitations
- API Calls From PowerBI
- Relating Entities
- Charts
- Conclusion
I have been playing with the Azure DevOps OData service recently to start creating some reports. Most of my fiddling has been with the Work Item and Work Item Board Snaphot entities, but I recently read a great post focused more on Build metrics by my friend and fellow ALM MVP, Wouter de Kort. I just happened to be working with a customer that is migrating from Azure DevOps Server to Azure DevOps Services and they had some SSRS reports that I knew could fairly easily be created using OData and PowerBI. In this post I’ll go over some of my experiences with the OData service and share a PowerBI template so that you can start creating some simple build reports yourself.
TL;DR
If you just want the PowerBI template, then head over to this Github repo and have at it!
Exploring Metadata
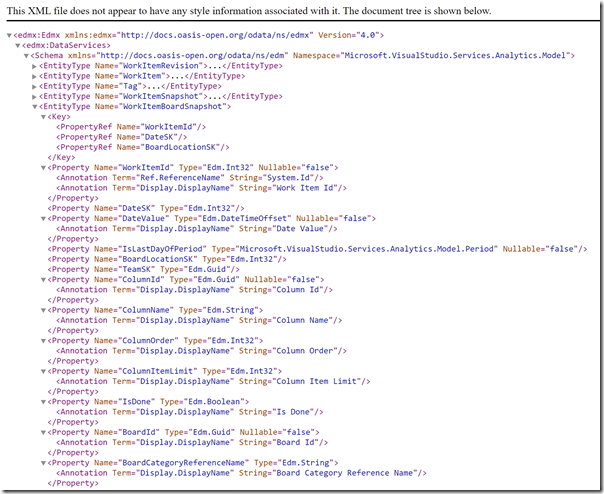
If you want to see what data you can grab from the OData endpoint for your Azure DevOps account, then navigate to this URL: https://analytics.dev.azure.com/{organization}/_odata/v3.0-preview/$metadata (you’ll need to replace {organization} with your organization name). This gives an XML document that details the entities and relationships. Here’s a screenshot of what it looks like in Chrome:
To get the data for an entity, you need to use OData queries. Some of these are pretty obscure, but powerful. First tip: pluralize the entity to get the entries. For example, the entity “Build” is queried by navigating to https://analytics.dev.azure.com/{organization}/_odata/v3.0-preview/Builds. You definitely want to learn how to apply $filter (for filtering data), $select (for specifying which columns you want to select), $apply (for grouping and aggregating) and $expand (for expanding fields from related entities). Once you have some of these basics down, you’ll be able to get some pretty good data out of your Azure DevOps account.
Here’s an example. Let’s imagine you want a list of all builds (build runs) from Sep 1st to today. The Build entity has the ProjectSK (an identifier to the project), but you’ll probably want to expand to get the Project name. Similarly, the Build entity includes a reference to the Build Definition ID, but you’ll have to expand to get the Build Definition Name. Here’s what the request would look like:
    https://analytics.dev.azure.com/{organization}/_odata/v3.0-preview/Builds?
       $apply=filter(CompletedDate ge 2019-09-01Z "
       &$select=*
       &$expand=Project($select=ProjectName),BuildPipeline($select=BuildPipelineName),Branch($select=RepositoryId,BranchName)
If you look at the metadata for the Build entity, you’ll see that there are navigation properties for Project, BuildPipeline, Branch and a couple others. These are the names I use in the $expand directive, using an internal $select to specify which fields of the related entities I want to select.
Connecting with PowerBI
To connect with PowerBI, you just connect to an OData field. You then have to expand some of the columns and do some other cleanup. Here’s what the M query looks like (view it by navigating to the “Advanced editor” for a query) for getting all the Builds since September 1st:
    let
        Source = OData.Feed ("https://analytics.dev.azure.com/" & #"AzureDevOpsOrg" & "/_odata/v3.0-preview/Builds?"
            & "$apply=filter(CompletedDate ge " & Date.ToText(Date.From(Date.AddDays(DateTime.LocalNow(), -14)), "yyyy-MM-dd") & "Z )"
            & "&$select=* "
            & "&$expand=Project($select=ProjectName),BuildPipeline($select=BuildPipelineName),Branch($select=RepositoryId,BranchName)"
         ,null, [Implementation="2.0",OmitValues = ODataOmitValues.Nulls,ODataVersion = 4]),
        #"Changed Type" = Table.TransformColumnTypes(Source,{ {"BuildSK", type text}, {"BuildId", type text}, {"BuildDefinitionId", type text}, {"BuildPipelineId", type text}, {"BuildPipelineSK", type text}, {"BranchSK", type text}, {"BuildNumberRevision", type text}}),
        #"Expanded BuildPipeline" = Table.ExpandRecordColumn(#"Changed Type", "BuildPipeline", {"BuildPipelineName"}, {"BuildPipelineName"}),
        #"Expanded Branch" = Table.ExpandRecordColumn(#"Expanded BuildPipeline", "Branch", {"RepositoryId", "BranchName"}, {"RepositoryId", "BranchName"}),
        #"Renamed Columns" = Table.RenameColumns(#"Expanded Branch",{ {"PartiallySucceededCount", "PartiallySucceeded"}, {"SucceededCount", "Succeeded"}, {"FailedCount", "Failed"}, {"CanceledCount", "Canceled"}}),
        #"Expanded Project" = Table.ExpandRecordColumn(#"Renamed Columns", "Project", {"ProjectName"}, {"ProjectName"})
    in
        #"Expanded Project"
Notes:
- Line 2: Connect to the OData feed Build entities (the #”AzureDevOpsOrg” is a parameter so that the account can be changed in a single place)
- Line 3: Use Date.ToText and other M functions to get dates going back 2 weeks
- Line 6: Standard OData feed arguments
- Lines 7-11: Update some column types, rename some columns and expand some record columns to make the data easier to work with
You can see how we can use PowerBI functions (like DateTime.LocalNow) and so on. This allows us to create dynamic reports.
Performance – Be Mindful
Be careful with your queries – try to aggregate where you can. For detail reports, make sure you limit the result sets using filters like date, team or team project and so on. You don’t want to be bringing millions of records back each time you refresh a report! For my particular report, I limit the date range to the builds completed in the last 2 weeks. In my case, that’s not a lot of data – but if you run hundreds of builds every day, even that date range might be too broad.
Limitations
There are still some gaps when using the OData feeds. For example, you can get TestRun and TestResult entities – both for automated as well as manual tests. This data is sufficient for doing some reporting on automated tests – but it’s impossible to tie the TestResults back to test plans and suites. The TestResult actually has a TestCaseReferenceId so you can get back to the Test Case, but there’s no way to aggregate these to Suites and Plans since these entities are entirely absent from the OData model. Or the Build entity has a relationship to the Branch entity, which contains a RepositoryId, but no repository name – and there isn’t an entity for Repo in the OData model either.
API Calls From PowerBI
Two other limitations that I found was that there’s no queue information in the OData fields (so you can’t see which queue a build was routed to) and there’s no code coverage information either. So doing any analysis on code coverage statistics or queues isn’t possible using pure OData. Wouter makes the same discovery in his blog post, where he calls out using PowerShell to call the Azure DevOps REST APIs to get some additional queue data.
However, you can call REST APIs from PowerBI. I wanted a report where users could filter by repo, so I wanted a list of repositories in my organization. I also wanted to include queue and code coverage information on the Build entities.
Before we look at how to do this in PowerBI, there is a caveat to doing API calls, especially if you’re looping over records: don’t do this for large datasets! When I was trying to aggregate test runs to test suites and plans, I was actually able to get a list of test plans and test suites in an organization using REST APIs. But then I wanted a list of test IDs in each Test Suite – and that’s when my dream died. The organization I was doing this for had over 20,000 Test Suites – that means that PowerBI would have to make over 20,000 REST API calls to get all the Tests in Test Suites in an organization. I was forced to abandon that plan. In short, be mindful of where you use your REST API calls, and try to limit the number of rows you’re making the calls for!
Another caveat is that while you can authenticate to the OData feed using org credentials, you need a PAT for the REST API call! So there are now two authentication mechanisms for the report – org account and PAT.
Enough caveats – let’s get to it!
Create a REST API Function
The first step is to create a function that can call the Azure DevOps API. Here’s the function to get a list of repositories for a give Team Project:
    (project as text) =>
    let
        Source = Json.Document(Web.Contents("https://dev.azure.com/" & #"AzureDevOpsOrg" & "/" & project & "/_apis/git/repositories?api-version=5.1"))
    in
        Source
This function takes a single arg called “project” of type text.
Now that we have the function defined, we can use it to expand a table with a list of Team Projects to end up with a list of all the repos in an org. Add a new Data Source, open the advanced editor and paste in this query:
    let
        Source = OData.Feed ("https://analytics.dev.azure.com/" & #"AzureDevOpsOrg" & "/_odata/v3.0-preview/Projects?"
            &"&$select=ProjectSK, ProjectName "
        ,null, [Implementation="2.0",OmitValues = ODataOmitValues.Nulls,ODataVersion = 4])
    in
        Source
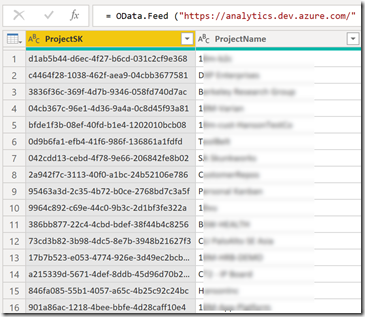
If it runs, you’ll get a table of projects in your Azure DevOps organization:
Now comes the magic:
- Click on Add Column in the ribbon
- Click on “Invoke Custom Function”
- Enter “Repos” as the new column name
- Select “GetGitRepos” (the function we created earlier) from the list of functions
- Make sure the type is set to column so that PowerBI will loop through each row in the table, calling the function
- Change the column to ProjectName – this is the value for the project arg for the function
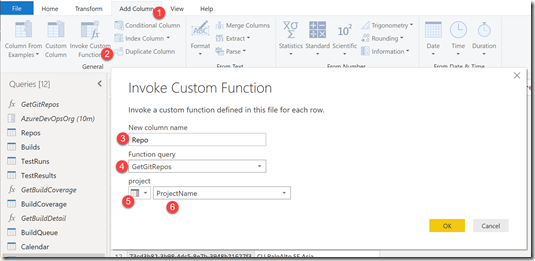
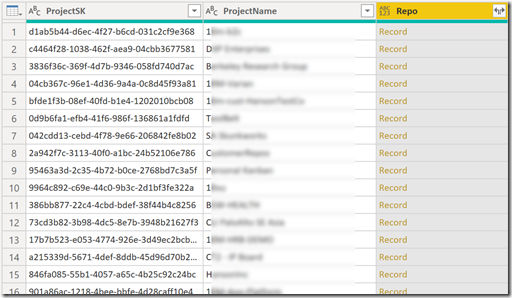
Once you click OK, PowerBI will call the function for each row in the table – this is why you don’t want to do this on a table with more than a few hundred rows! Here’s what the result will look like:
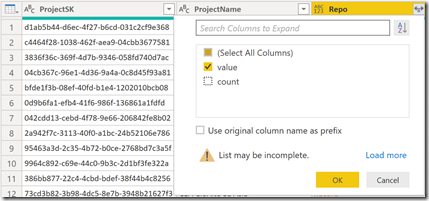
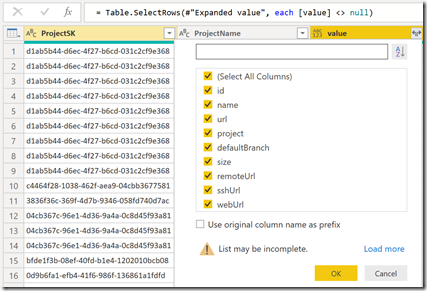
Now we want to expand the Record in each row, so click on the expand glyph to the right of the column name. We don’t really care about count, we just want value expanded and we don’t need the prefix:
This expands, but we’ll need to expand “value” once more, since it too is a complex object. Click the expand glyph again and select “Expand to Rows”. You can now filter out nulls – I could only do this by adding a line in the Advanced Editor: #"Filter nulls" = Table.SelectRows(#"Expanded value", each [value] <> null)
Don’t forget to change the “in” to #“Filter nulls”. You will then need to expand value again:
Now we can finally see the fields for the repo itself – I just selected name, size, defaultBranch and webUrl. Now you can update any types and rename columns as you need. We now have a list of repos! Here’s the final M query:
    let
       Source = OData.Feed ("https://analytics.dev.azure.com/" & #"AzureDevOpsOrg" & "/_odata/v3.0-preview/Projects?"
            &"&$select=ProjectSK, ProjectName "
        ,null, [Implementation="2.0",OmitValues = ODataOmitValues.Nulls,ODataVersion = 4]),
        #"Invoked Custom Function" = Table.AddColumn(Source, "Repos", each GetGitRepos([ProjectName])),
        #"Expanded Repos" = Table.ExpandRecordColumn(#"Invoked Custom Function", "Repos", {"value"}, {"Repos.value"}),
        #"Expanded Repos.value" = Table.ExpandListColumn(#"Expanded Repos", "Repos.value"),
        #"Filter nulls" = Table.SelectRows(#"Expanded Repos.value", each [Repos.value] <> null),
        #"Expanded Repos.value2" = Table.ExpandRecordColumn(#"Filter nulls", "Repos.value", {"id", "name", "defaultBranch", "size", "webUrl"}, {"Repos.value.id", "Repos.value.name", "Repos.value.defaultBranch", "Repos.value.size", "Repos.value.webUrl"}),
        #"Renamed Columns1" = Table.RenameColumns(#"Expanded Repos.value2",{ {"Repos.value.id", "RepositoryId"}, {"Repos.value.name", "Name"}, {"Repos.value.defaultBranch", "DefaultBranch"}, {"Repos.value.size", "Size"}, {"Repos.value.webUrl", "WebURL"}})
    in
        #"Renamed Columns1"
For adding queue information to builds, I created a function to get build detail for a build number (so that I could extract the queue). For code coverage, I created a function to call the coverage API for a build – again expanding the records that came back. You can see the final queries in the template.
Relating Entities
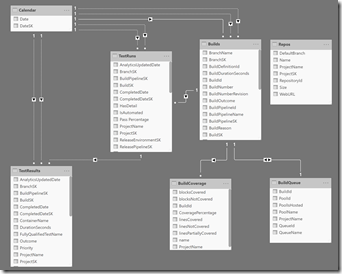
Now that I have a few entities, PowerBI detects most of the relationships. I added a CalendarDate table so that I could filter all builds/tests on a particular date (the CompletedDate column is a DateTime field, so this is necessary to group on a day). The final ERD looks like this:
I had some trouble relating branch to repo, so I eventually just added a LOOKUP function to lookup the repo name for the branch via the repositoryId. That’s why Repo isn’t related to other entities in the ERD. Similarly, I originally had a Project entity, but found that creating slicers on the Project column in the build worked just fine and kept the ERD simple.
Charts
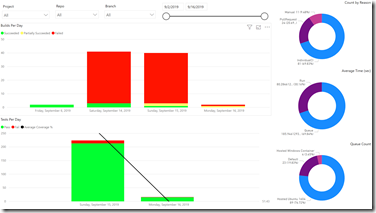
I created two simple reports in the template – one showing a Build Summary and another showing a test summary. Feel free to start from these and go make some pretty reports!
To open the template, you can get it from this Github repo. There’s also instructions on how to update the auth.
Conclusion
The OData feed for Azure DevOps is getting better – mixing in some REST API calls allows you to fill in some gaps. If you’re careful about your filtering and what data you’re querying, you’ll be able to make some compelling reports. Go forth and measure…
Happy reporting!
