Aurelia – Debugging from within Visual Studio

In my last couple of posts I’ve spoken about the amazing Javascript framework, Aurelia, that I’ve been coding in. Visual Studio is my IDE of choice – not only because I’m used to it but because it’s just a brilliant editor – even for Javascript, Html and other web technologies. If you’re using VS for web development, make sure that you install Web Essentials – as the name implies, it’s essential!
Debugging
One of the best things about doing web development in VS – especially if you have a lot of Javascript – is the ability to debug from within VS. You set breakpoints in your script, run your site in IE, and presto! you’re debugging. You can see call-stack, autos, set watches – it’s really great. Unfortunately, until recently I haven’t been able to debug Aurelia projects in VS. We’ll get to why that is shortly – but I want to take a small tangent to talk about console logging in Aurelia. It’s been the lifesaver I’ve needed while I work out why debugging Aurelia wasn’t working.
Console
Few developers actually make use of the browser console while developing – which is a shame, since the console is really powerful. The easiest way to see it in action is to open an Aurelia project, locate app.ts (yes, I’m using TypeScript for my Aurelia development) and add a “console.debug(“hi there!”) to the code:
import auf = require("aurelia-framework");
import aur = require("aurelia-router");

export class App {
    static inject = [aur.Router];

    constructor(private router: aur.Router) {
        console.log("in constructor");
        this.router.configure((config: aur.IRouterConfig) => {
            config.title = "Aurelia VS/TS";
            config.map([
                { route: ["", "welcome"], moduleId: "./views/welcome", nav: true, title: "Welcome to VS/TS" },
                { route: "flickr", moduleId: "./views/flickr", nav: true },
                { route: "child-router", moduleId: "./views/child-router", nav: true, title: "Child Router" }
            ]);
        });
    }
}
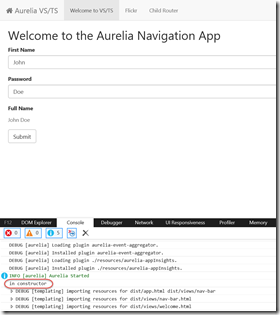
Line 8 is where I add the call to console.log. Here it is in IE’s console when I run the solution:
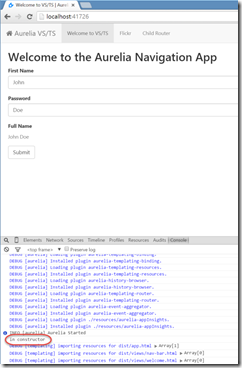
(To access the console in Chrome or in IE, press F12 to bring up “developer tools” – then just open the console tab). Here’s the same view in Chrome:
There are a couple of logging methods: log(), info(), warn(), error() and debug(). You can also group entries together and do host of other useful debugging tricks, like timing or logging stack traces.
Logging an Object
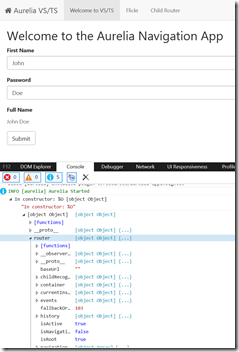
Beside simply logging a string message you can also log an object. I found this really useful to inspect objects I was working with – usually VS lets you inspect objects, but since I couldn’t access the object in VS, I did it in the console. Let’s change the “console.log” line to “console.log(“In constructor: %O”, this);” The “%O” argument tells the console to log a hyperlink to the object that you can then use to inspect it. Here is the same console output, this time with “%O” (Note: you have to have the console open for this link to actually expand – otherwise you’ll just see a log entry, but won’t be able to inspect the object properties):
You can now expand the nodes in the object tree to see the properties and methods of the logged object.
Aurelia Log Appenders
If you’re doing a lot of debugging, then you may end up with dozens of view-models. Aurelia provides a LogManager class – and you can add any LogAppender implementation you want to create custom log collectors. (I do this for Application Insights so that you can have Aurelia traces sent up to App Insights). Aurelia also provides an out-of-the-box ConsoleLogAppender. Here’s how you can add it (and set the logging level) – I do this in main.ts just before I bootstrap Aurelia:
auf.LogManager.addAppender(new aul.ConsoleAppender());
auf.LogManager.setLevel(auf.LogManager.levels.debug);
Now we can change the app.ts file to create a logger specifically for the class – anything logged to this will be prepended by the class name:
import auf = require("aurelia-framework");
import aur = require("aurelia-router");

export class App {
    private logger: auf.Logger = auf.LogManager.getLogger("App");

    static inject = [aur.Router];

    constructor(private router: aur.Router) {
        this.logger.info("Constructing app");

        this.router.configure((config: aur.IRouterConfig) => {
            this.logger.debug("Configuring router");
            config.title = "Aurelia VS/TS";
            config.map([
                { route: ["", "welcome"], moduleId: "./views/welcome", nav: true, title: "Welcome to VS/TS" },
                { route: "flickr", moduleId: "./views/flickr", nav: true },
                { route: "child-router", moduleId: "./views/child-router", nav: true, title: "Child Router" }
            ]);
        });
    }
}
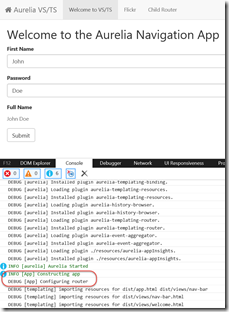
On line 5 I set up a logger for the class – which I then use in lines 10 and 13. Here’s the console output:
You can see how the “info” and the “debug” are colored differently (and info has a little info icon in the left gutter) and both entries are prepended with “[App]” – this makes wading through the logs a little bit easier. Also, when I want to switch the log level, I just set it down to LogManager.levels.error and no more info or debug messages will appear in the console – no need to remove them from the code.
Why Can’t VS Debug Aurelia?
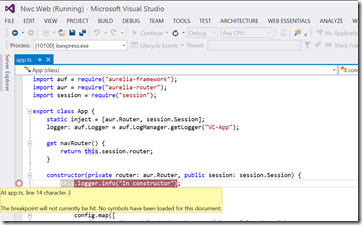
Back to our original problem: debugging Aurelia in Visual Studio. Here’s what happens when you set a breakpoint using the skeleton app:
Visual Studio says that “No symbols have been loaded for this document”. What gives?
The reason is that Visual Studio cannot debug modules loaded using system.js. Let’s look at how Aurelia is bootstrapped in index.html:
<body aurelia-app>
    <div class="splash">
        <div class="message">Welcome to Aurelia</div>
        <i class="fa fa-spinner fa-spin"></i>
    </div>
    <script src="jspm_packages/system.js"></script>
    <script src="config.js"></script>

    <!-- jquery layout scripts -->
    <script src="Content/scripts/jquery-1.8.0.min.js"></script>
    <script src="Content/scripts/jquery-ui-1.8.23.min.js"></script>
    <script src="Content/scripts/jquery.layout.min.js"></script>

    <script>
    //System.baseUrl = 'dist';
    System.import('aurelia-bootstrapper');
    </script>
</body>
You can see that system.js is being used to load Aurelia and all its modules – it will also be the loader for your view-models. I’ve pinged the VS team about this – but haven’t been able to get an answer from anyone as to why this is the case.
Switching the Loader to RequireJS
Aurelia (out of the box) uses jspm to load its packages – and it’s a great tool. Unfortunately, for anyone who wants to debug with VS you’ll have to find another module loader. Fortunately Aurelia allows you to swap out your loader! I got in touch with Mike Graham via the Aurelia gitter discussion page – and he was kind enough to point me in the right direction – thanks Mike!
Following some examples by Mike Graham, I was able to switch from system.js to requirejs. The switch is fairly straight-forward – here they are:
- Create a bundled require-compatible version of aurelia using Mike’s script and add it to the solution as a static script file. Updating the file means re-running the script and replacing the aurelia-bundle. Unfortunately this is not as clean an upgrade path as jspm, where you’d just run “jspm update” to update the jspm packages automatically.
- Change the index.html page to load require.js and then configure it.
- Make a call to load the Aurelia run-time using requirejs.
- Fix relative paths to views in router configurations – though this may not be required for everyone, depending on how you’re referencing your modules when you set up your routes.
Here’s an update index page that uses requirejs:
<body aurelia-main>
    <div class="splash">
        <div class="message">Welcome to Aurelia AppInsights Demo</div>
        <i class="fa fa-spinner fa-spin"></i>
    </div>

    <script src="Content/scripts/core-js/client/core.js"></script>
    <script src="Content/scripts/requirejs/require.js"></script>
    <script>
        var baseUrl = window.location.origin
        console.debug("baseUrl: " + baseUrl);
        require.config({
            baseUrl: baseUrl + "/dist",
            paths: {
                aurelia: baseUrl + "/Content/scripts/aurelia",
                webcomponentsjs: baseUrl + "/Content/scripts/webcomponentsjs",
                dist: baseUrl + "/dist",
                views: baseUrl + "/dist/views",
                resources: baseUrl + "/dist/resources",
            }
        });

        require(['aurelia/aurelia-bundle-latest']);
    </script>
</body>
Now instead of loading system.js, you need to load core.js and require.js. Then I have a script (this could be placed into its own file) which configures requirejs (lines 9-24). I set the baseUrl for requirejs as well as some paths. You’ll have to play with these until requirejs can successfully locate all or your dependencies and view-models. Line 23 then loads the Aurelia runtime bundle via requirejs – this then calls your main or app class, depending on how you configure the <body> tag (either as aurelia-main or aurelia-app).
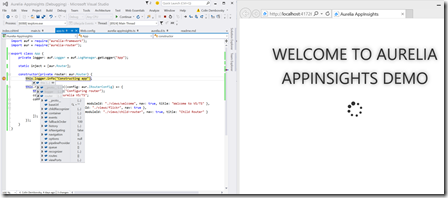
Now that you’re loading Aurelia using requirejs, you can set breakpoints in your ts file (assuming that you’re generating symbols through VS or through Gulp/Grunt):
Voila – you can now debug Aurelia using VS!
Conclusion
When you’re doing Aurelia development using Visual Studio, you’re going to have to decide between the ease of package update (using jspm) or debugging ability (using requirejs). Using requirejs requires (ahem) a bit more effort since you need to bundle Aurelia manually, and I found getting the requirejs paths correct proved a fiddly challenge too. However, the ability to set breakpoints in your code in VS and debug is, in my opinion, worth the effort. I figure you’re probably not going to be updating the Aurelia framework that often (once it stabilizes after release) but you’ll be debugging plenty. Also, don’t forget to use the console and log appenders! Every tool in your arsenal makes you a better developer.
Happy debugging!
P.S. If you know how to debug modules that are loaded using system.js from VS, please let the rest of us know!
