Application Insights Telemetry for WAWS or Customer-Hosted Sites Without MMA

There are a couple of tools that change the development landscape significantly for .Net developers. One such tool is IntelliTrace – this revolutionizes how you debug production issues. Another game-changing tool is Application Insights.
There are a few broad categories for Application Insights telemetry – APM (Application Performance Monitoring), Availability, Usage and Diagnostics. In order to leverage APM and Diagnostics, you need to install Microsoft Monitoring Agent (MMA) on your IIS server. This isn’t a problem if you’re using an on-premises IIS or using your own VM in the cloud. However, if you’ve got a website that’s running on Windows Azure Websites (WAWS) or your site is going to be hosted on someone else’s tin or cloud, then you can’t install MMA. However, not all is lost – you can still get Availability and Usage telemetry for these scenarios.
Add Application Insights to Your Web App
Normally this is as easy as installing the Application Insights VS Extensions, right-clicking your Web Application and selecting “Add Application Insights Telemetry”. This adds an ApplicationInsights.config file to your project that allows you to configure Application Insights. This works great in conjunction with MMA. Of course, the scenario we’re talking about is one where there is no MMA.
This scenario is supported, but there’s not a lot of guidance on how to do it. In cases where I’m running my site on WAWS or I’ve created a website that my customer is going to be hosting on their infrastructure (be that on their own premises, their own public cloud or even on Azure) and there’s no MMA, you can still get some really good telemetry. I also had the goal of minimizing admin and configuration footprint as much as possible, since I don’t want to have to maintain lots of config files on other people’s infrastructure. Happily, you can get a lot of good telemetry with a single application setting. Let’s see how to do it.
Create an Application in Application Insights
For the WAWS (or customer-hosted website) scenarios, you need to create an application in Application Insights. This will generate a unique (guid) key for the application. This is the only piece of config you really need.
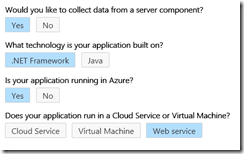
The first thing you need to do is “Choose Your Adventure” in Application Insights. There isn’t an adventure path for the scenario we’re trying, so we’ll hijack the Web Service adventure. Log into your VSO account and go to Application Insights. Click on “Overview” and then “Add Application”. Follow the prompts along the following path:
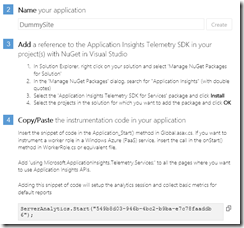
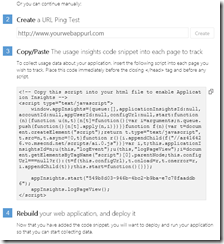
AppInsights will give us a list of instructions at this point. Since we’re going off-track on this adventure, we’ll ignore most of the instructions – we really just need the Application ID.
Type a name for your application into “Step 2” and click “Create”. Then copy the guid from Step 4 (this is the application ID we need to tie AppInsights events to this application in AppInsights):
Note: You can get the application ID at any time by clicking on the gear icon in the top right of AppInsights. Then click the “Keys & Downloads” tab, select your application in the drop-down on the top left and scroll down to the “Web Services SDK” section. The guid there is the one you need for your application:
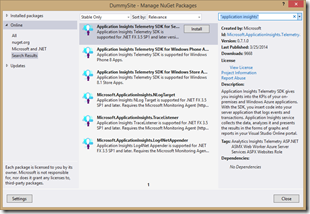
Follow the instructions in Step 3 – you can follow them here if you like. Select your web application in Solution Explorer, right-click and select “Manage NuGet packages”. Then type in “application insights” (including the quotes) and install the Application Insights SDK package.
Once that’s done, you can add the following code to your Global.asax.cs file:
var appInsightsKey = ConfigurationManager.AppSettings["AppInsightsID"];
if (string.IsNullOrEmpty(appInsightsKey))
{
    ServerAnalytics.Enabled = false;
}
else
{
    ServerAnalytics.Start(appInsightsKey);
}
Now add a key to your application settings in your Web.config:
<add key="AppInsightsID" value="guid">
</add>
The value for the key is the guid you copied earlier when you created the Application in AppInsights. If you deploy this to another customer, create a new Application in AppInsights and update the key in the config file. That’s it.
Setup Usage Telemetry from the Browser
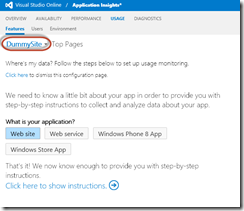
To get usage telemetry from the browser (like Language, OS, Browser Type, Geographic Region etc.) you need to add some javascript to the pages you want to track. Back in Application Insights, you can click on the “Usage” tab. Make sure your new application is selected on the top left. Then click “Web site” for the type of application you want usage stats from. Click on “Click here to show instructions” at the bottom.
If your site is on WAWS, you’ll want to create a ping test when you’ve published your application – if it’s already in Azure, then go ahead and enter the site url for the ping-test. This is a synthetic monitor that can give you a bit of basic availability information about your site. Of course when it’s on your customer’s infrastructure there may not even be a publically accessible url.
What’s important for now though is that you’ll see the usage insights snippet in step 3. You can copy that code if you like – though I made a slight modification to this code to make the application ID a parameter, rather than a hard-coded value.
I’ve got an MVC application, so I’ve added the usage snippet javascript (mixed with a little Razor) into the _Layout.cshtml page:
<script type="text/javascript">
    var appInsightsKey = "@System.Configuration.ConfigurationManager.AppSettings["AppInsightsID"]";
    if (appInsightsKey !== null || appInsightsKey.length > 0) {
        window.appInsights = { queue: [], applicationInsightsId: null, accountId: null, appUserId: null, configUrl: null, start: function (n) { function u(n, t) { n[t] = function () { var i = arguments; n.queue.push(function () { n[t].apply(n, i) }) } } function f(n) { var t = document.createElement("script"); return t.type = "text/javascript", t.src = n, t.async = !0, t } function r() { i.appendChild(f("//az416426.vo.msecnd.net/scripts/ai.0.js")) } var i, t; this.applicationInsightsId = n; u(this, "logEvent"); u(this, "logPageView"); i = document.getElementsByTagName("script")[0].parentNode; this.configUrl === null ? r() : (t = f(this.configUrl), t.onload = r, t.onerror = r, i.appendChild(t)); this.start = function () { } } };
        appInsights.start(appInsightsKey);
        appInsights.logPageView();
    }
</script>
You can see how I added a C# call (using Razor) to read the applicationID from the web.config – it’s the same call that the code in Global.asax.cs makes.
Custom Events
So that will “buy” me some usage telemetry as well as page hits – all for free (almost). However, I wanted to add some specific events and even do some timing on events so that I can monitor performance. To do that I had to add some code into my methods.
You can log an event (just give it a name – the name allows a hierarchy separated by “/”). You can log a timed event – call StartTimedEvent() with the same naming convention. Later, you call event.End() or event.Cancel() to stop timing. Furthermore, you can log these events with metrics (and/or properties) using a Dictionary. Here are some snippets of stuff you can do:
Create a Timed Event for a Controller method:
var aiEvent = ServerAnalytics.CurrentRequest.StartTimedEvent("DummySite/Index");

try
{
    // do stuff
    aiEvent.End();
}
catch(Exception ex)
{
    // log stuff
    aiEvent.Cancel();
    throw;
}

return View();
Here’s just logging an event:
public ActionResult Contact()
{
    ServerAnalytics.CurrentRequest.LogEvent("DummySite/Contact");
    ViewBag.Message = "Your contact page.";

    return View();
}
Here’s an event with some properties:
public ActionResult About()
{
    var even = DateTime.Now.Second % 2 == 0 ? "even" : "odd";
    var props = new Dictionary<string, object="">() { { "mod", even } };

    ServerAnalytics.CurrentRequest.LogEvent("DummySite/About", props);

    ViewBag.Message = "Your application description page.";

    return View();
}</string,>
Of course you can add whatever custom events you need – the beauty of the API is that once you’ve called the Start method (in the Global.asax.cs) you don’t need to worry about IDs or config at all.
Now just publish and start monitoring! (Don’t forget to set your ping-test in the Availability tab in AppInsights if your site is publically available and you haven’t done it before).
Viewing the Data in Application Insights
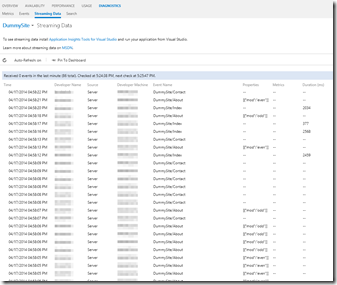
When you debug your application locally, you can check you events in the “Diagnostics->Streaming Data” page on AppInsights.
Once you’ve published your application, you’ll see events start flooding in.
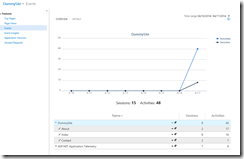
In the Usage->Features->Events page, you’ll see your events, organized into the hierarchy you specified with the / notation:
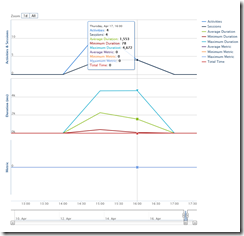
When I first saw this page, I couldn’t figure out where the timing for the timed events was. You can click on the little arrow (left of the pin icon for each event) or click the “DETAILS” link on the top left of the graph.
Clicking on the “dummysite/index” event arrow takes me to the details for that event, where I can analyze the timings:
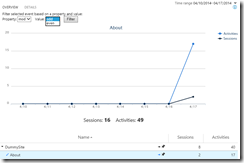
Clicking on the “dummysite/about” event, I get to see the properties (in this case, “mod” is the property and the values are “even” or “odd” – you can filter the graph by a particular value):
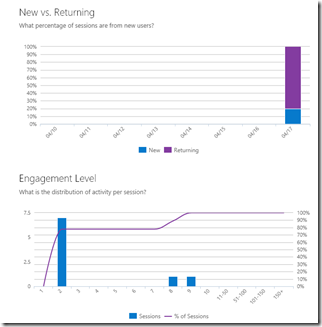
The Usage->User page shows user/session specific telemetry – mine aren’t all that interesting since I only logged on with 1 user.
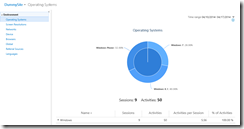
Clicking on Usage->Environment gives me some telemetry around browsers, OSs, locations and so on.
All in all, it’s a LOT of data for only a couple of minor edits to code. You can also add *some* of this data to Dashboards, so you can make custom Dashboards for monitoring your sites.
Best of all, if I give this application to many different customers, all I need to do is supply them with a new AppInsightsID for their web.config file and I’ll instantly get telemetry. Very cool!
Happy monitoring!
